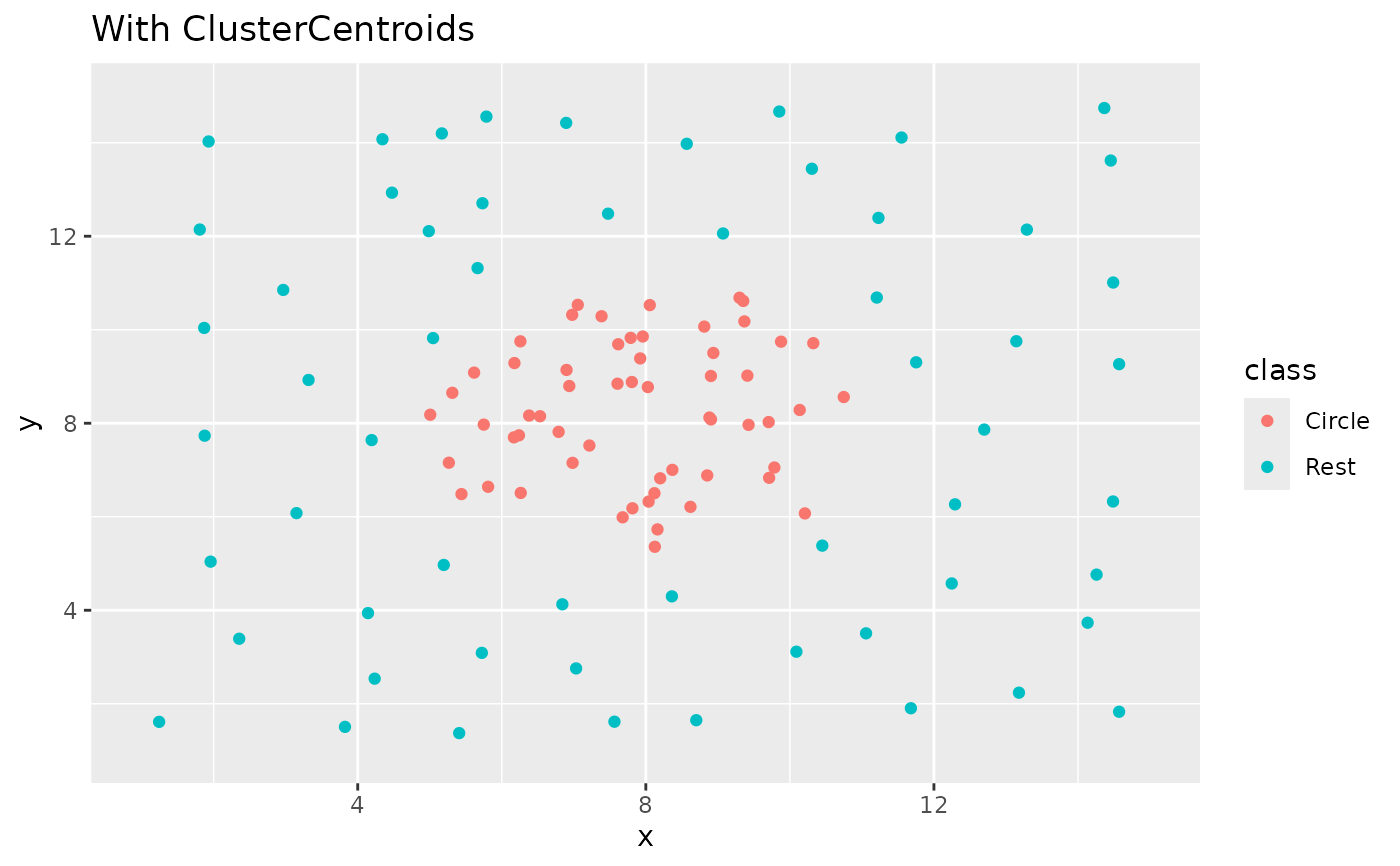
step_cluster_centroids() creates a specification of a recipe step that
removes majority class instances by replacing each majority class with
cluster representatives found with k-means.
Usage
step_cluster_centroids(
  recipe,
  ...,
  role = NA,
  trained = FALSE,
  column = NULL,
  under_ratio = 1,
  voting = "soft",
  skip = TRUE,
  seed = sample.int(10^5, 1),
  distance_with = recipes::all_predictors(),
  id = rand_id("cluster_centroids")
)
Arguments
- recipe
A recipe object. The step will be added to the sequence of operations for this recipe.
- ...
One or more selector functions to choose which variable is used to sample the data. See recipes::selections for more details. The selection should result in single factor variable. For the
tidymethod, these are not currently used.- role
Not used by this step since no new variables are created.
- trained
A logical to indicate if the quantities for preprocessing have been estimated.
- column
A character string of the variable name that will be populated (eventually) by the
...selectors.- under_ratio
A numeric value for the ratio of the majority-to-minority frequencies. The default value (1) means that all other levels are sampled down to have the same frequency as the least occurring level. A value of 2 would mean that the majority levels will have (at most) (approximately) twice as many rows than the minority level.
A named numeric vector can be used instead to give different levels different targets, for example
c(a = 2, b = 3). The names must be levels of the outcome and the values are ratios of the minority level, exactly as in the single-number case. Levels that are not named are left untouched, as are rows with a missing outcome. Because a vector of targets is not a single value, supplying one means this argument can no longer be tuned. Seevignette("ratio", package = "themis")for more details.- voting
A character string. Either
"soft"(the default) to use the cluster centroids themselves, or"hard"to use the observation closest to each centroid.- skip
A logical. Should the step be skipped when the recipe is baked by
bake()? While all operations are baked whenprep()is run, some operations may not be able to be conducted on new data (e.g. processing the outcome variable(s)). Care should be taken when usingskip = TRUEas it may affect the computations for subsequent operations.- seed
An integer that will be used as the seed when applied.
- distance_with
A call to a selector function to choose which variables are used to compute the clusters. Defaults to
recipes::all_predictors(). The variable selected by...is always excluded from the clustering.- id
A character string that is unique to this step to identify it.
Value
An updated version of recipe with the new step
added to the sequence of existing steps (if any). For the
tidy method, a tibble with columns terms which is
the variable used to sample.
Details
Each class larger than the target count is summarized by running k-means on the observations of that class, using as many clusters as the target count. The class is then replaced by one representative per cluster:
voting = "soft"the cluster centroids themselves are used, so the returned observations are synthetic points that need not appear in the input.
voting = "hard"the observation closest to each centroid is used, so all returned observations are real rows. The representative is always picked from the class being under-sampled.
This makes it the one prototype generation under-sampler in this package. The other under-sampling methods perform prototype selection, keeping a subset of the original rows.
Because two clusters can share the same closest observation, voting = "hard" can return slightly fewer observations than the target count.
All columns in the data are sampled and returned by recipes::juice()
and recipes::bake().
All columns selected by distance_with must be numeric with no missing
data.
When used in modeling, users should strongly consider using the
option skip = TRUE so that the extra sampling is not
conducted outside of the training set.
Non-predictor columns
With voting = "soft" the observations of an under-sampled class are
replaced by synthetic points, and columns that are not selected by
distance_with have no value for those points. Such columns are set to NA,
as they are for the over-sampling steps that synthesize observations. Use
voting = "hard" if these columns must be kept intact.
Tidying
When you tidy() this step, a tibble is returned with
columns terms and id:
- terms
character, the selectors or variables selected
- id
character, id of this step
Tuning Parameters
This step has 1 tuning parameters:
under_ratio: Under-Sampling Ratio (type: double, default: 1)
Case weights
The underlying operation does not allow for case weights. Supplying data with a case weights column to this step results in an error.
See also
cluster_centroids() for direct implementation
Other Steps for under-sampling:
step_cnn(),
step_downsample(),
step_enn(),
step_instance_hardness(),
step_ncl(),
step_nearmiss(),
step_oss(),
step_tomek()
Examples
library(recipes)
library(modeldata)
data(hpc_data)
hpc_data0 <- hpc_data |>
select(-protocol, -day)
orig <- count(hpc_data0, class, name = "orig")
orig
#> # A tibble: 4 × 2
#> class orig
#> <fct> <int>
#> 1 VF 2211
#> 2 F 1347
#> 3 M 514
#> 4 L 259
up_rec <- recipe(class ~ ., data = hpc_data0) |>
# Bring the majority levels down to about 1000 each
# 1000/259 is approx 3.862
step_cluster_centroids(class, under_ratio = 3.862) |>
prep()
training <- up_rec |>
bake(new_data = NULL) |>
count(class, name = "training")
training
#> # A tibble: 4 × 2
#> class training
#> <fct> <int>
#> 1 VF 1000
#> 2 F 1000
#> 3 M 514
#> 4 L 259
# Since `skip` defaults to TRUE, baking the step has no effect
baked <- up_rec |>
bake(new_data = hpc_data0) |>
count(class, name = "baked")
baked
#> # A tibble: 4 × 2
#> class baked
#> <fct> <int>
#> 1 VF 2211
#> 2 F 1347
#> 3 M 514
#> 4 L 259
library(ggplot2)
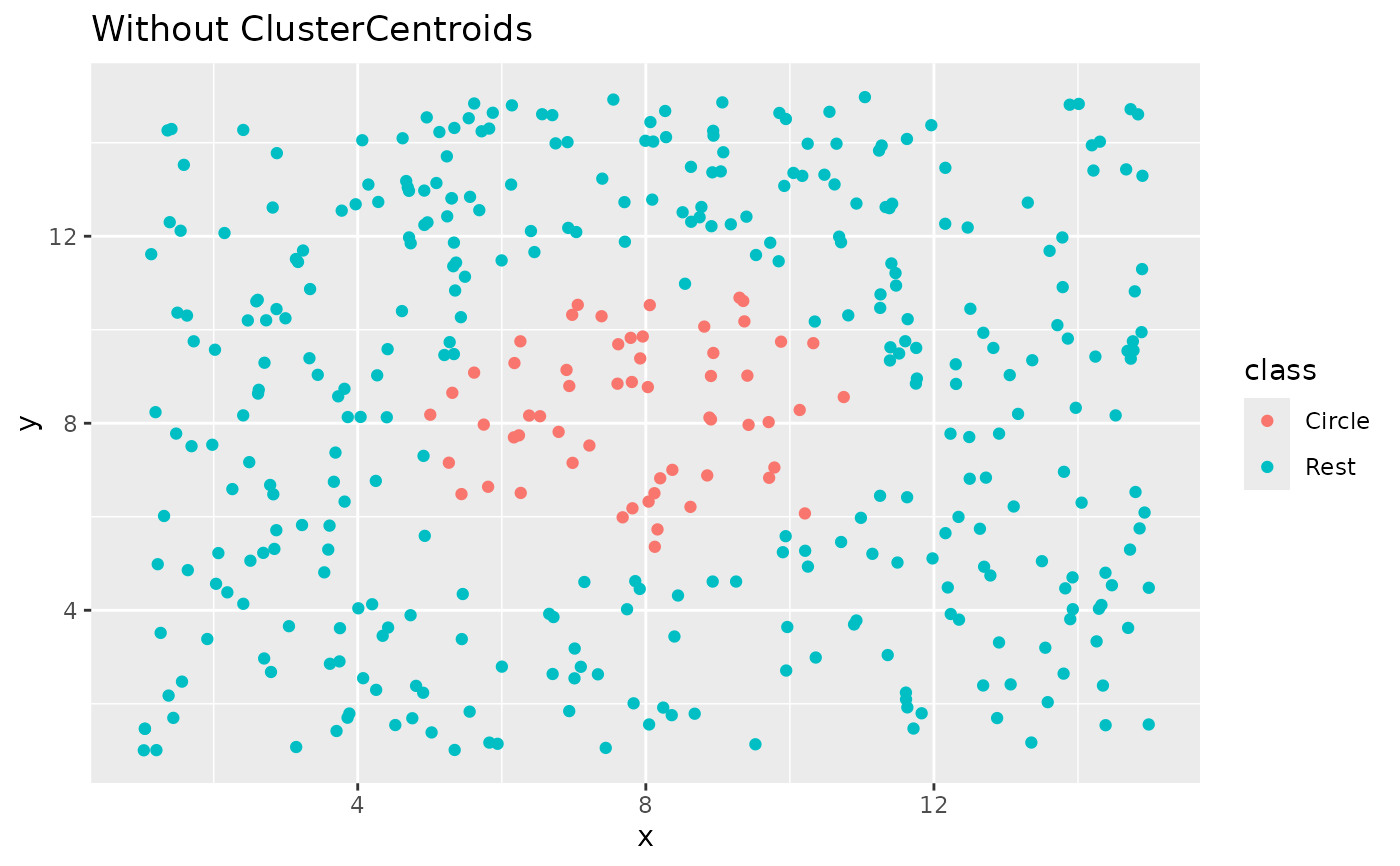
ggplot(circle_example, aes(x, y, color = class)) +
geom_point() +
labs(title = "Without ClusterCentroids") +
xlim(c(1, 15)) +
ylim(c(1, 15))
 recipe(class ~ x + y, data = circle_example) |>
step_cluster_centroids(class) |>
prep() |>
bake(new_data = NULL) |>
ggplot(aes(x, y, color = class)) +
geom_point() +
labs(title = "With ClusterCentroids") +
xlim(c(1, 15)) +
ylim(c(1, 15))
recipe(class ~ x + y, data = circle_example) |>
step_cluster_centroids(class) |>
prep() |>
bake(new_data = NULL) |>
ggplot(aes(x, y, color = class)) +
geom_point() +
labs(title = "With ClusterCentroids") +
xlim(c(1, 15)) +
ylim(c(1, 15))